
Improving BubbleUp Comprehension
BubbleUp is one of Honeycomb's most powerful features, and a competitive differentiator, yet it had extremely low usage among all payment plans, but particularly self-service plans.
We wanted to make it easier for new and self-service customers to discover and understand how to use BubbleUp.
What is BubbleUp?
BubbleUp lets users identify anomalies in their data by highlighting outliers.
Once they highlight their data, they are shown a series of charts that display the fields with the greatest difference between the selected data and everything else in order to drill down into potential problem areas.

Great for power users, overwhelming for new users
Users loved BubbleUp once they understood it, but nearly all regular users of the feature were introduced to it through instructor-led sessions.
New users had tremendous difficultly understanding the value of BubbleUp if they discovered it on their own.
Research Details
Too many charts
The BubbleUp results display around 15 or so miniature charts, with no clear indication of what the charts mean.
To further confuse matters, there's a set of donut charts in the corner of each chart with information about the field as a whole. Many users initially thought these charts were toggle switches. Even power users admitted the rarely used those charts.
Additionally, the charts are ordered by the fields where there's the biggest discrepancy between the baseline and the selection, meaning the most useful charts are displayed first, but there's nothing in the UI to indicate that.

Confusing hover states
The details for each line of each graph were shown in a modal when the user hovered over them.
With so many lines and so many charts it quickly overwhelmed new users.
What's confusing to new users is essential to power users
While the information density was incredibly overwhelming for new users, that information density was precisely what made BubbleUp so valuable for our power users.
“The point of BubbleUp is that you have to pick out smorgasbord of interesting things – don’t try to simplify it so much that you lose the value of the information density.”
Objectives
We needed to figure out how to make the interface less overwhelming to new users, while still preserving the information density that power users valued.
Data visualization explorations
I did a number of different explorations around alternative ways to display the data.

I experimented with different layouts, hiding the donut charts, changing the donut charts to bars that doubled as a legend, and displaying the attribute information inline, rather than in a modal.
I also added an indicator for the level of difference to clarify why the charts appeared in the order that they did.


Displaying the most important attribute by default
After pairing with several of the engineers on the team, as well as other members of the design team, we landed on a new chart design that showed the attribute information below the chart, and displayed the information for the most important value by default.
The field information that had formerly been in the donut charts was hidden by default and displays in a tooltip when you hover over the field name.
We also added improved helper text.

User Validation
In order to determine whether the redesign was effective, we tracked metrics related to adoption, comprehension, and retainment.
As of this writing, the new BubbleUp design is still under development. However, we did receive positive feedback in our user validation tests.
Our testers reported that:
It's still a lot of information, but they were better able to hone in on what was most important
Getting rid of all the hover effects made the experience less overwhelming
Surfacing the level of difference made it clear why charts were ordered the way they were
Hiding the field information cut down on information density without removing value - those who really wanted the information were still able to find it
Power users still saw enough information to get value out of BubbleUp
Research Details
More projects
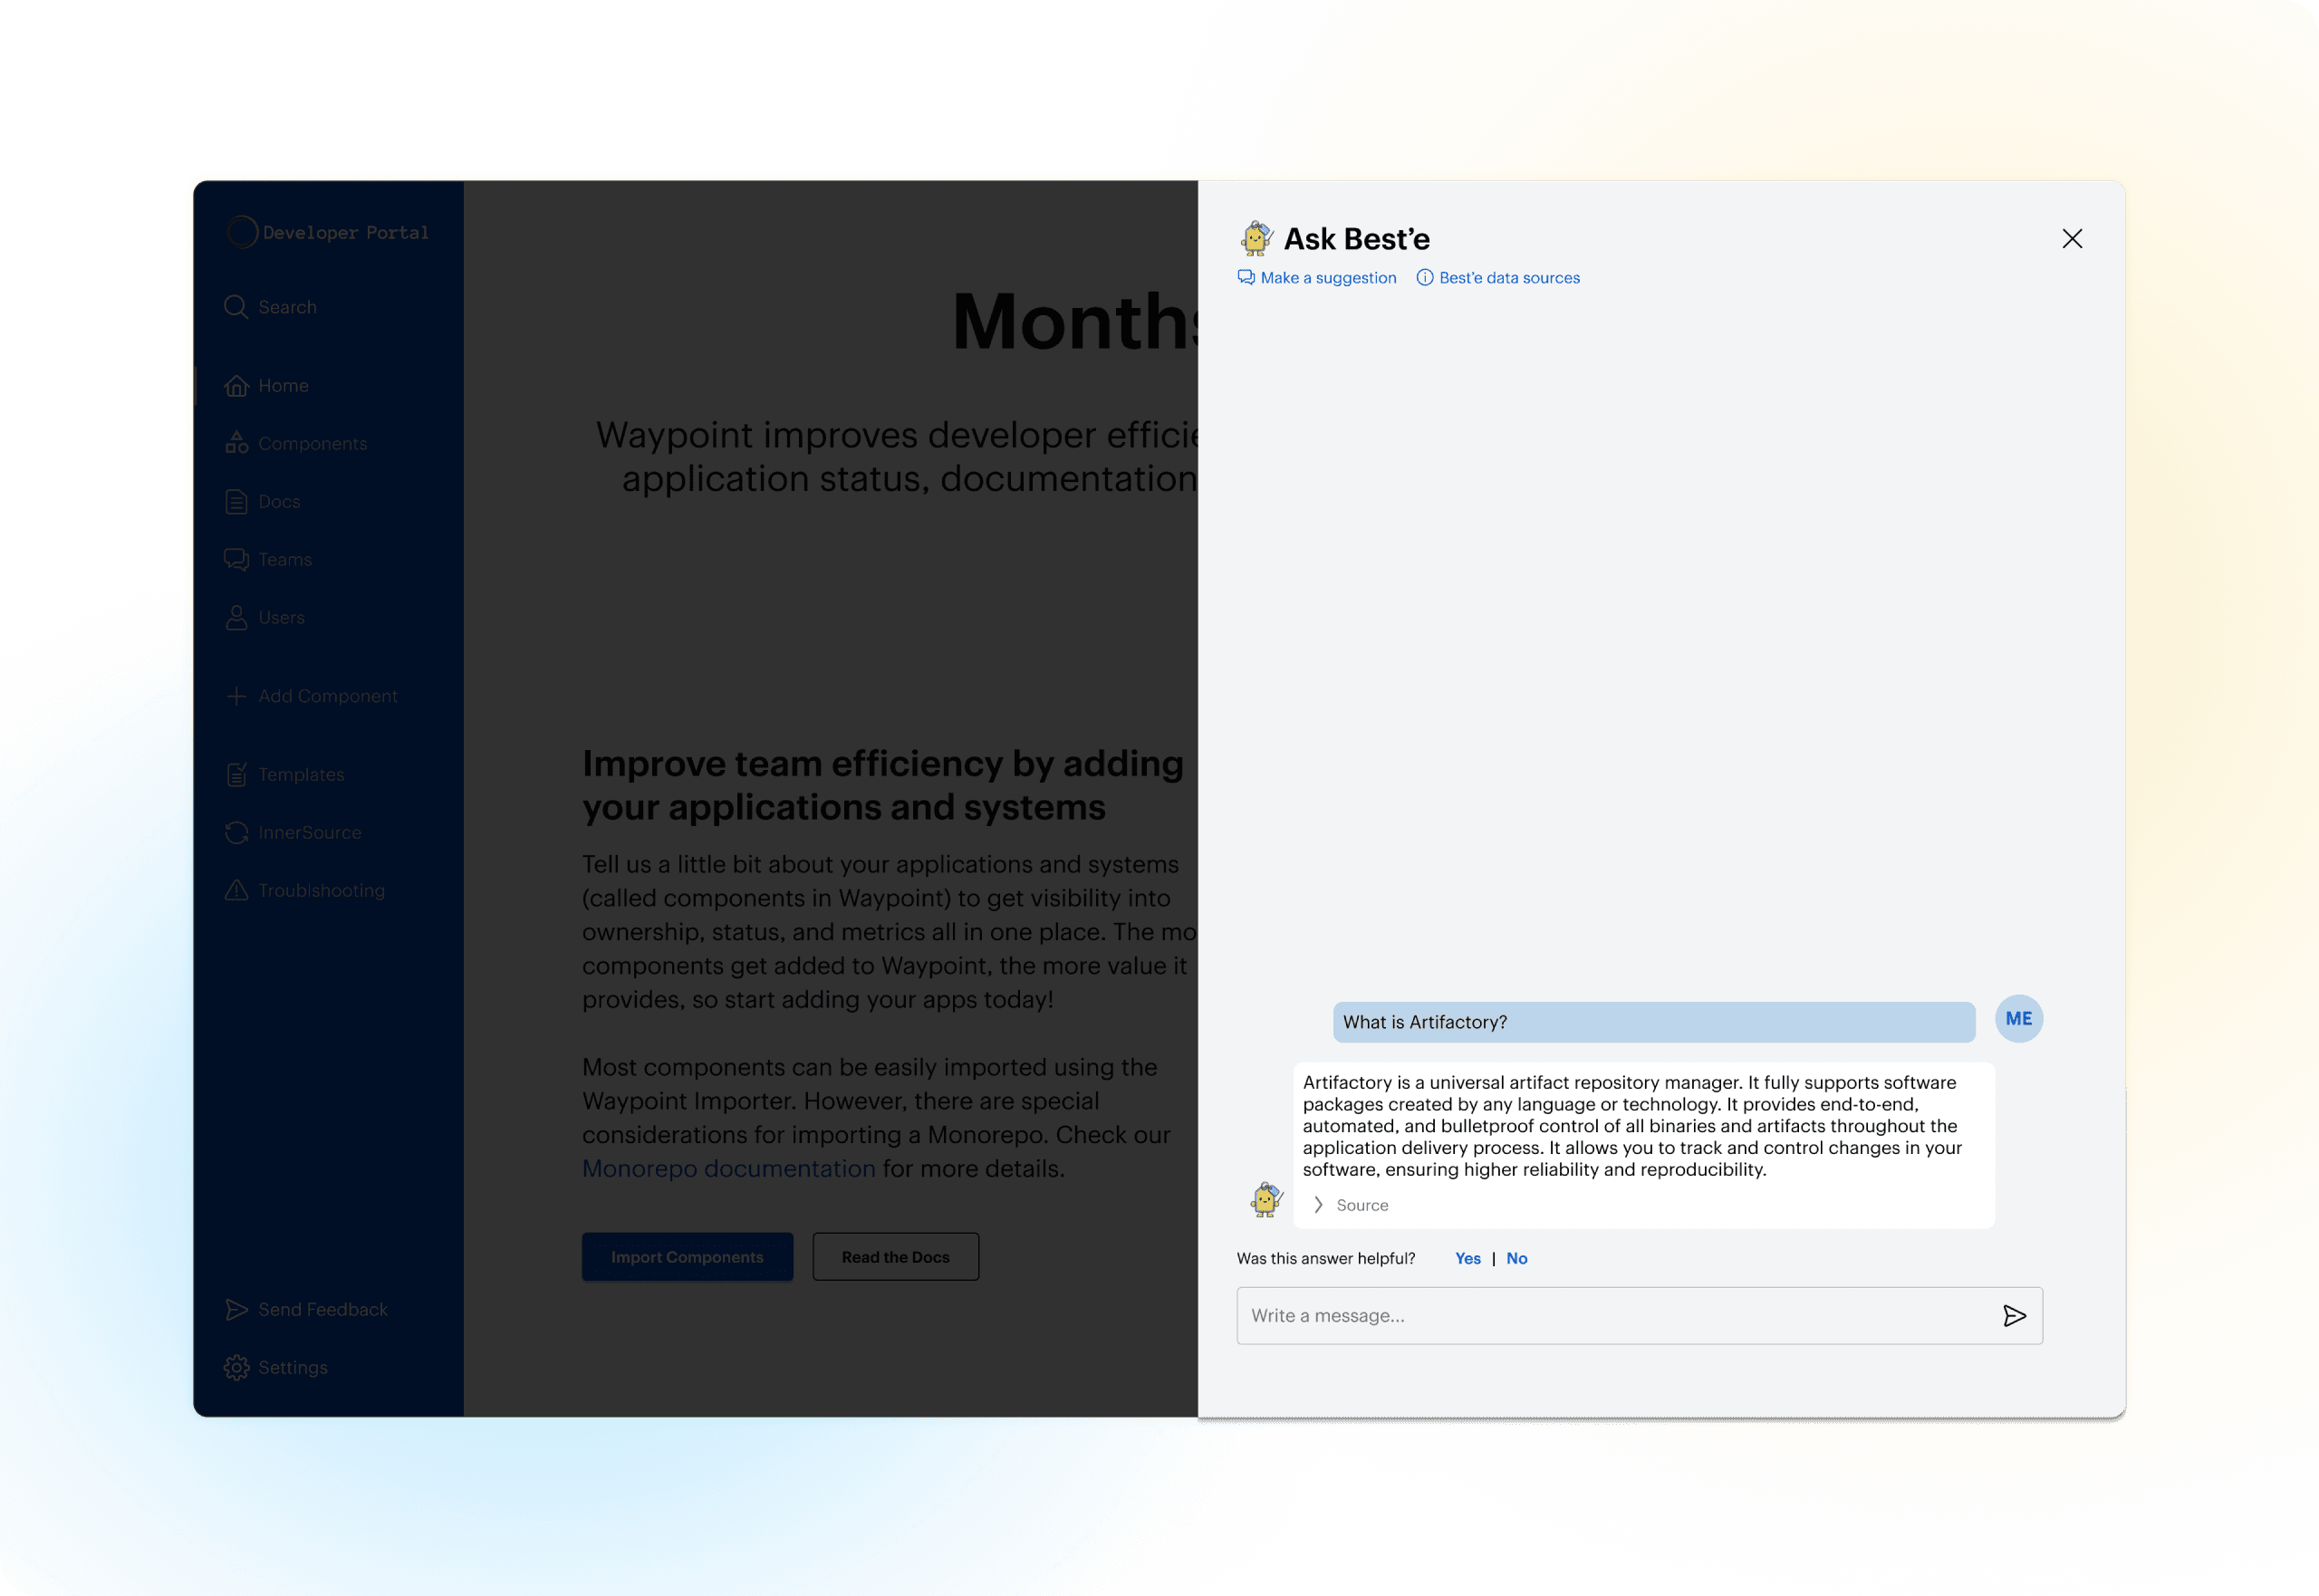
Creating an AI Digital Assistant
